What is an index?
An index is a method to track the performance of a group of assets in a standardized way. Indexes typically measure the performance of a basket of securities intended to replicate a certain area of the market. These could be a broad-based index that captures the entire market, such as the S&P500 or Dow Jones Industrial Average (DJIA), or more specialized such as indexes that track a particular industry or segment.
Investopedia (source)
In more concrete terms imagine an index like a grade characterising the performance of the market or of a specific industry or segment of it. The index will be a composition of a set of stocks that together will give an overall value (which is the index).
You could have for example an index of the US stock market that includes hundreds of US companys’ stocks, and that will represent as best as possible the US market.
Thus you guessed, there are two types of indexes:
- broad market indexes: that tracts an overall market (e.g. US market, world market, swiss market)
- specialized indexes: that track a specific industry or market segment (e.g. cybersecurity market, cloud market, semiconductors market)
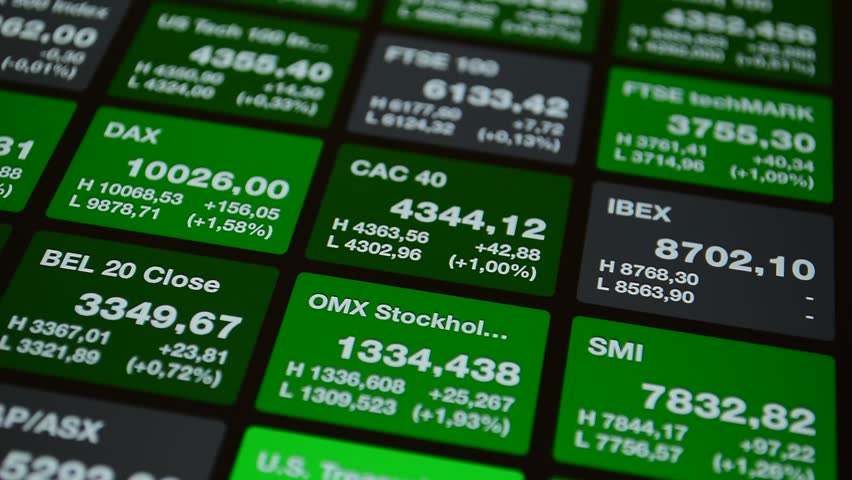
These indexes are extremely useful to understand how the market is performing and his overall health. You often can see these numbers on TV in the news when presenters are talking about market levels (see figure below).
And in addition if you are willing to follow certain specific sectors, for example the Technology sector, you will be able to do it with a Technology index.
Examples of indexes
Here are some example of US market broad market indexes:
- S&P500: represents the US stock market by tracking the 500 largest publicly-traded companies in the U.S (it represents 80% of the overall stock trades in the US stock market)
- Dow Jones Industrial Average (DJIA): tracks 30 large, publicly-owned blue-chip companies trading on the New York Stock Exchange and the NASDAQ
- Nasdaq 100 Index: represents de 100 biggest US companies and most actively traded (it included companies from non-financial sectors include retail, biotechnology, industrial, technology, health care, and excludes the financial sector)
- Nasdaq Composite Index: represents 2,500 common equities listed on the Nasdaq stock exchange (including stocks, real-estate investment trusts, American depositary receipts, …)
- Wilshire 5000 Total Market Index: composed of 3,451 publicly traded companies headquartered in the US, and that are actively traded
- Russell 3000 Index: represents the performance of the 3,000 largest U.S.-traded stocks which represent about 98% of the overall traded US stocks
Here are some example of World market broad market indexes:
- MSCI EAFE: contains more than 900 stocks from 21 countries (Europe, Australasia, and the Middle East) and excludes US and Canadian markets
- MSCI ACWI: ACWI means All Country World. It covers over 3,000 securities across large, mid and small-cap size segments and across style and sector segments in 50 Developed and Emerging Markets
- MSCI World: This index covers over 1,600 securities from 23 developed countries all over the world. This index also covers the United States.
Concerning the specialized indexes, there are tons existing per industry and segment. So you will have to search on Google based on the target you want to follow, but here are few examples:
- Morgan Stanley Biotech Index: tracks 36 US companies in the biotechnology industry
- Wilshire US REIT: tracks more than 80 US real estate investment trusts.
How are stocks selected per index
Each index has its own requirements when selecting the companies that should be included in the index. But there are some basic criteria that most of the main indexes are following:
- Market capitalization: the market value of a publicly-traded company’s outstanding shares
- Liquidity: easy or difficult it would be for a market participant to sell the stocks without impacting the price
- Free float: the portion of shares of a corporation that are in the hands of public investors
- Minimum monthly trading volume
- Financial viability
Types of indexes
In the previous sections, we talked a lot about indexes and their characteristics, but we are missing an important topic. There are mainly 4 types of indexes based on the methodology used to calculate their numbers:
- price-weighted indexes
- market capitalization-weighted indexes
- float-adjusted capitalization-weighted indexes
- equal-weighted indexes
When investing in the stock market there is a high change that you will invest in funds that are related to these type of indexes. And by knowing how there indexes and built and what they track, you will have better knowledge to select the best funds for you. Depending on the type of index these funds follow, they will be more/less volatile, will be investing more in small/large corporation, will have small/larger fees and are expected to perform with higher/smaller returns.
Price-weighed indexes
A price-weighted index is a stock index in which each company included in the index makes up a fraction of the total index proportional to that company’s share stock price per share. In its simplest form, adding the price of each stock in the index and dividing by the total number of companies determines the index’s value.
Investopedia (source)
So in a price-weighted index, if the company is weighted by its price per share and the index is the average of the share prices of all the companies. So this means that the higher the stock price is, the higher will be its weight in the index.
What is the purpose of a price-weighted index?
The purpose of a price-weighted index is to track the average stock price of a given market or industry.
How to calculate a price-weighted index?
Here are 5 companies with their related data for the calculation
| Company | Number of stocks | Stock price |
|---|---|---|
| Company A | 10 million | $2 |
| Company B | 6 million | $4 |
| Company C | 1 million | $6 |
| Company D | 2 million | $8 |
| Company E | 4 million | $10 |
The formula to be used to calculate the index value is:
Index value = Sum of stocks prices / Number of companiesSo in our case:
Index value = ($2 + $4 + $6 + $8 + $10) / 5 = 6And if we want to calculate the weight of a company in the index:
Company A weight = 100% x Stock price Company A / (Sum of values of all stocks)So in our case:
Company A weight = 100% x $2 / ($2 + $4 + $6 + $8 + $10) = 100% x $2 / $30 = 6.66%What are examples of price weighted indexes?
- Dow Jones (US)
- Nikkei 225 (Japan)
Advantages of price-weighted indexes
- The weighting scheme is simple to understand
- The values are simple to calculate
Disadvantages of price-weighted indexes
- Miss-leading picture of the market with small companies with large stock price having more impact than large companies with a smaller stock price
- Inconsistent effect of stock price changes with small variations on large stock prices having more effect than large variations on small stock prices
Capitalization-weighted indexes
A capitalization-weighted index is a type of stock market index where individual components of the index are included in amounts that correspond to their total market capitalization (shortened as “market cap”). A company’s market capitalization is calculated by multiplying its outstanding shares by the current price of a single share.
Investopedia (source)
So in a capitalization-weighted index, stocks are given importance in proportion to their market capitalization (which is the number of shares traded on the stock market x the value of a share). So the higher the market cap of a company, the higher will be its weight in the index.
How to calculate a capitalization-weighted index?
Let’s take again our 5 companies
| Company | Number of stocks | Stock price |
|---|---|---|
| Company A | 10 million | $2 |
| Company B | 6 million | $4 |
| Company C | 1 million | $6 |
| Company D | 2 million | $8 |
| Company E | 4 million | $10 |
This calculation is more complex than the previous one, so let’s split it into different steps.
Let’s start by calculating the total capitalization of the index:
Total capitalization = number of share x value per share

Total capitalization = (10M x $2) + (6M x $4) + (1M x $6) + (2M x $8) + (4M x $10)

Total capitalization = 106 millions $
Then the index capitalization:
Index capitalization = (total capitalization of the companies) / number of companies

Index capitalization = 106M / 5 = 21,200,000
Now let’s calculate the weight of each company in the index:
Weight company A = 100% x (10M x $2) / 106M = 18.8%

Weight company B = 100% x (6M x $4) / 106M = 22.6%

Weight company C = 100% x (1M x $6) / 106M = 5.7%

Weight company D = 100% x (2M x $8) / 106M = 15.1%

Weight company E = 100% x (4M x $10) / 106M = 37.8%
So the end value of the index is:
Index value = Sum (Company weight x Company share price)

Index value = (18.8% x $2) + (22.6% x $4) + (5.7% x $6) + (15.1% x $8) + (37.8% x $10)

Index value = 6.61
What are examples of capitalization-weighted indexes?
- S&P 500 (US)
- Nasdaq (US)
- Wilshire 5000 (US)
- Hang Seng (Hong Kong)
Advantages of capitalization-weighted indexes
- The index accurately shows the picture of the economy since each companies capitalization is taken into account making large corporations having more impact on the index (like they have on the overal economy)
Disadvantages of capitalization-weighted indexes
- Large companies have a big influence on these indexes
- If investors bet on a large company, making the price go up a lot, then the index doesn’t show anymore the reality of the market
- The values are complex to calculate
Float-adjusted capitalization-weighted indexes
These indexes are a sub-category of the capitalization-weighted indexes.
In the float-adjusted case, companies in the index will be weighted just like capitalization-weighted index, but the market capitalization of each company will be considered only based on the shares available for trading.
For example if the company A used in the previous example has a total of 10M shares, but only 80% are available for trading on the stock market, then the number of shares to use for the calculation is this 80% which equals to 8M shares.
Equal-weighed indexes
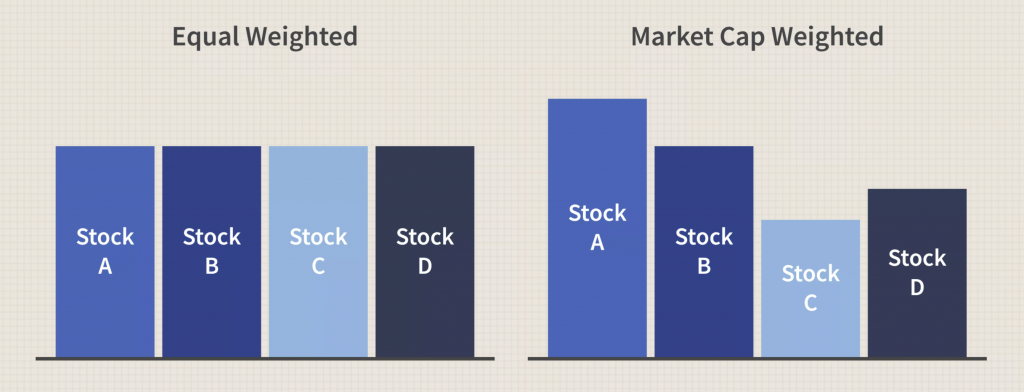
An equal-weighted index invests an equal amount of money in the stock of each company that makes up the index. Thus, the performance of each company’s stock carries equal importance in determining the total value of the index.
Corporatefinanceinstitute (source)
So in this type of index each company is given the same weight in the index. The figure below should give you a better understanding of it since it compares the equal-weight to the capitalization-weighted indexes.
How to calculate an equal-weighted index?
Let’s take again our 5 companies
| Company | Number of stocks | Stock price |
|---|---|---|
| Company A | 10 million | $2 |
| Company B | 6 million | $4 |
| Company C | 1 million | $6 |
| Company D | 2 million | $8 |
| Company E | 4 million | $10 |
Even if these 5 companies have a different amount of shares and market capitalization, with the equal-weighted index, all these companies will be considered with the same weight.
So the weight of each company will be:
Company weight = 100% / number of companies

Company weight = 100% / 5 = 20%
And the Index value will be:
Index value = Sum (Company stock price x weight)

Index value = $2 x 20% + $4 x 20% + $6 x 20% + $8 x 20% + $10 x 20%

Index value = 20% x ($2 + $4 + $6 + $8 + $10) = 6
What are examples of equal-weighted indexes?
- Invesco Russell 1000 Equal Weight ETF (US)
- NASDAQ-100 Equal Weighted Index Fund (US)
- S&P 500 Equal Weight ETF (US)
Advantages of equal-weighted indexes
- Their diversification is higher than cap-weighted indexes, thus they carry less risk to be caught in market bubbles
- Equal-weighted funds focus on value investing, which is believed to be a superior investment strategy
Disadvantages of equal-weighted indexes
- Equal-weighted indexes have higher fees to extra rebalancing to keep proportions of companies, which results in higher transaction costs and less favorable tax treatments
- Equal-weighted funds tend to be more volatile than cap-weighted that have a higher proportion of large bluechip stocks
- It is harder for Equal-weighted funds to manage large amounts of money since they need to invest in both large and small companies
American stock indices: Deep-dive
We have talked a lot about indexes and since one of the most important market for stock market investors is the US markets, let’s take a deeper view of the main indexes representing the American market: Dow Jones, S&P500 and Nasdaq
Dow Jones
The Dow Jones Industrial Average, Dow Jones, or simply the Dow, is a stock market index that measures the stock performance of 30 large companies listed on stock exchanges in the United States.
Wikipedia (source)
The following table lists the main characteristics of this index:
| Info | Data |
|---|---|
| Weighting method | Price-weighted index |
| Constituent | 30 large US companies |
| Market cap | $8.33 trillion (Dec. 2019) |
| Foundation | February 16, 1885 |
| Location | New York, USA |
| Type | Large-cap |
You can find in the image below the list of constituents of the Dow Jones as of August 2020.
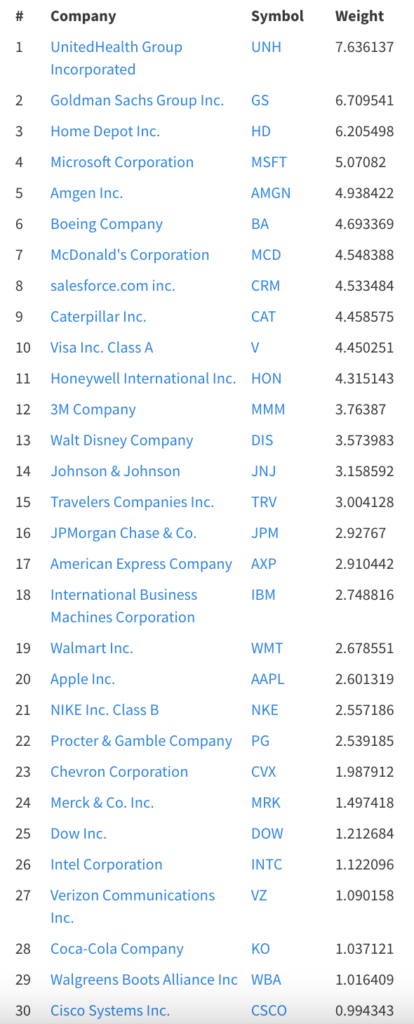
Since the Dow Jones only included a limited number of large US companies, the constituents doesn’t often change making it a consistent index over the years.
The index is used to show the overall health position of the US stock market and also the economy.
Nasdaq composite

The Nasdaq Composite is a stock market index that includes almost all stocks listed on the Nasdaq stock Exchange. The composition of the NASDAQ Composite is heavily weighted towards companies in the information technology sector.
Wikipedia (source)
One thing to note here is that the Nasdaq stock exchange is really different from the Nasdaq Composite index, so don’t confuse between the two. The Nasdaq index is an indicator of how the companies listed on the Nasdaq stock exchange are performing. The index includes all the companies that are listed on the Nasdaq Stock Exchange with a few restrictions.
The following table lists the main characteristics of this index:
| Info | Data |
|---|---|
| Weighting method | Capitalization-weighted index |
| Constituent | 3,097+ US companies (Apr. 2021) |
| Market cap | $19.4 billion (2021) |
| Foundation | February 16, 1885 |
| Location | New York, USA |
| Type | Large-cap |
Here is a list of the top 20 companies that are part of the index. Bear in mind that since it’s a capitalization-weighted index and that tech companies are gigantic, the top 10 represents 1/3 of the index performance.
- Apple (NASDAQ:AAPL)
- Microsoft (NASDAQ:MSFT)
- Amazon (NASDAQ:AMZN)
- Facebook (NASDAQ:FB)
- Alphabet Class C (NASDAQ:GOOG)
- Alphabet Class A (NASDAQ:GOOGL)
- Tesla (NASDAQ:TSLA)
- NVIDIA (NASDAQ:NVDA)
- PayPal Holdings (NASDAQ:PYPL)
- ASML Holdings (NASDAQ:ASML)
- Intel (NASDAQ:INTC)
- Comcast (NASDAQ:CMCSA)
- Netflix (NASDAQ:NFLX)
- Adobe (NASDAQ:ADBE)
- Cisco Systems (NASDAQ:CSCO)
- PepsiCo (NASDAQ:PEP)
- Broadcom (NASDAQ:AVGO)
- Texas Instruments (NASDAQ:TXN)
- Pinduoduo (NASDAQ:PDD)
- T-Mobile US (NASDAQ:TMUS)
So the Nasdaq usually includes many companies and frequently changes the composition of the index unlike the Dow Jones.
The index is used to track the evolution of the US stock market but focusing on the technology sector.
S&P 500
The Standard and Poor’s 500, or simply the S&P 500, is a free-float, weighted measurement stock market index of the 500 large companies listed on stock exchanges in the United States.
Wikipedia (source)
The following table lists the main characteristics of this index:
| Info | Data |
|---|---|
| Weighting method | Free-float Capitalization-weighted |
| Constituent | 505 US companies (May 2021) |
| Market cap | $33.4 trillion (Jan 2021) |
| Foundation | March 4, 1957 |
| Location | New York, USA |
| Type | Large-cap |
You can find in the image below the list of the top 20 constituents of the S&P 500 as of May 2021.
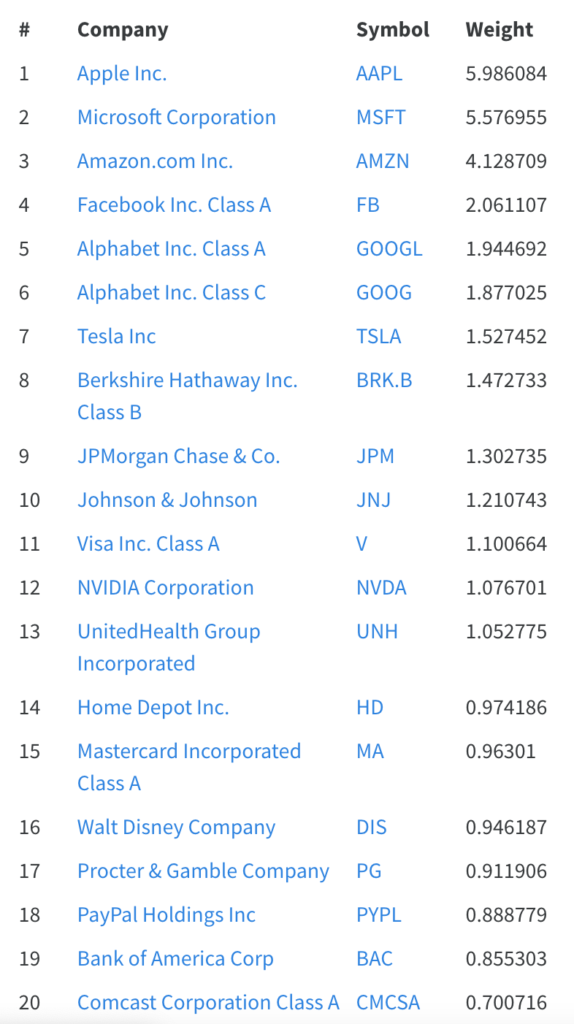
The image below gives an interesting view of the proportions between companies in the S&P500, where you can see big tech being predominant.
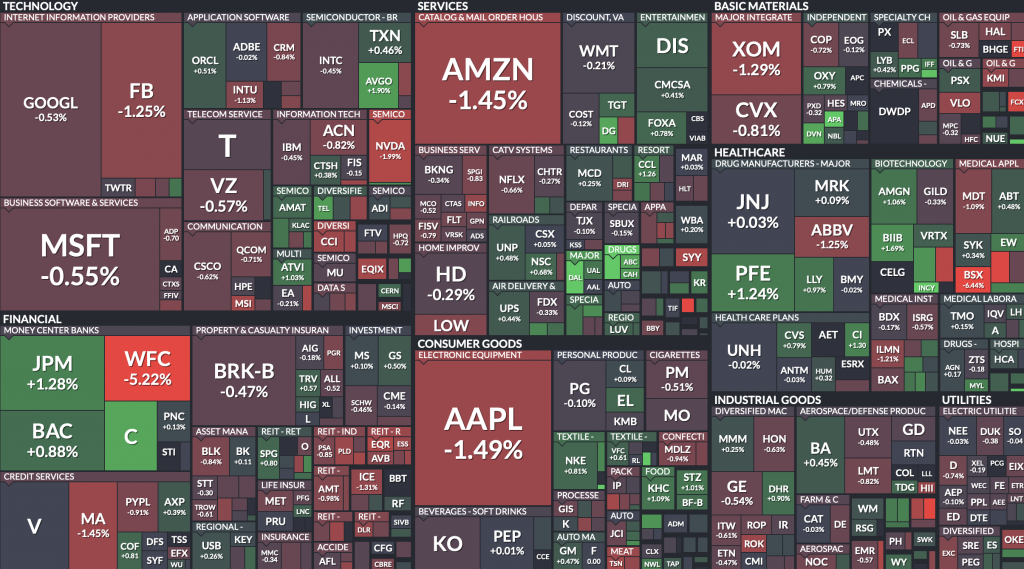
The S&P 500 is considered the best indicator for the overall position of the US market. Thanks tot he 500 companies it tracks, the index represents 75% of the U.S. equity market in terms of capitalization.
As the index consists of 500 widely traded companies, it includes companies in a variety of sectors including information technology, healthcare, financials, energy, industrials and consumer staples.
← Previous |
Back to start |
Next → |