With the influx of Crypto buyers, we wanted to introduce some tools to help make more solid trading decisions. Rather than the “I think Dogecoin is a good investment.” This article is our Beginner Crypto Technical Analysis, and we also have a Beginner Crypto Fundamental Analysis.
Introduction
As Crypto traders, we have many tools that we can use to analyze the crypto market. One approach is known as Technical Analysis. With Technical analysis, a trader can better understand the market’s sentiment and identify significant trends developing in the market. The resulting data and their predictions of further price movement can be used to make a more educated trading decision.
The technical analysis considers the coin’s history by looking at its price charts and the coin’s trade volumes but ignores what the coin project is doing currently or its plans for the future. This study system is the opposite of fundamental analysis, which focuses on determining if a coin is either over or undervalued.
Technical analysis is based on Dow Theory. To understand technical analysis, we need to understand Dow Theory’s fundamentals:
- When pricing an asset (like a cryptocurrency), the market takes into account everything. All prior, current, and upcoming information has been integrated into the current price of the asset. When we think about cryptos, this is composed of many variables like the coin’s past, current, and future demand and proposed regulations that could impact the crypto market. The coin’s current price is the market’s response to all available information, including expectations and knowledge about each crypto coin being traded. Technical analysts will interpret the price data and what it suggests about the market sentiment to make a calculated prediction about the future price.
- Asset prices do not move randomly; they will often follow trends that can be either long or short-term. After a trend is formed, the coin will follow the trend until it is opposed. Technicians attempt to identify and profit from trends by using technical analysis tools.
- Technical analysis values “what” over “why.” Technical analysts will focus more on the price of a coin rather than the variables that are behind the scenes, causing the price movement. While there are multiple factors that could or are having an influence on the coin’s price, making it move in a particular direction, technical analysts are specifically reviewing the coin’s supply and demand.
- In trading, history (human reactions and moves) tend to be repeated. Predicting market psychology is possible, and traders will sometimes react in similar ways when they are presented with similar stimuli.
“Those who do not remember the past are condemned to repeat it.“
George Santayana
Crypto Technical Analysis Tools
The following are the basic tools needed to conduct your crypto technical analysis.
Trend Lines
Trend lines are indicators of the specific direction that a coin’s price is moving. Trendlines are the first weapons used by a trader when conducting technical analysis; however, identifying trends is easier said than done.
Cryptos, by their nature, are quite volatile, and watching a Bitcoin price movement chart will likely reveal a number of highs and lows forming a linear pattern. With this in mind, Technical Analysts know that they can disregard the volatility and look for an upward trend when they discover a series of higher highs or a downward trend when they see lower lows.
A technical trader can also discover a trend of sideways price movement when a coin is neither moving significantly up or down.
Additionally, a technical analyst should know that trends can form in short, medium, and long terms. So a short-term trend might be downward, but the long-term trend is upward.
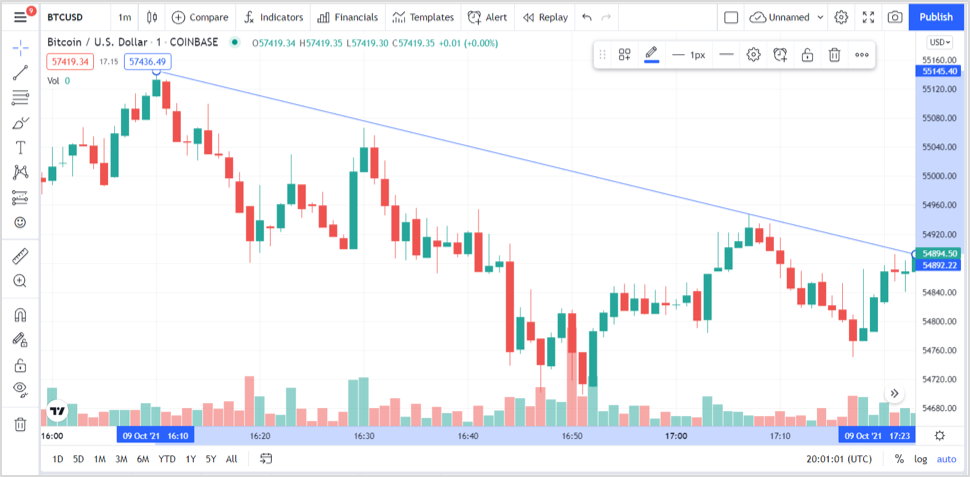
PRO TIP: when you draw your trend lines, you want to be accurate. How can you do this? When you hover over a candle, you will see that the lowest price which is marked with an “L” and the highest price marked with the “H” see the gree numbers below

The high is 54819.15 and the low is 54755.78 for the above candle. You will place your line on the “H” if the direction is down and “L” if it is up. You will then extend the line roughly where it touches the next candle and zoom in to correct it and be perfect. You will then finish the process by auto extending the line with the line’s “Setting” in most cases, this will be to the right of the graph.
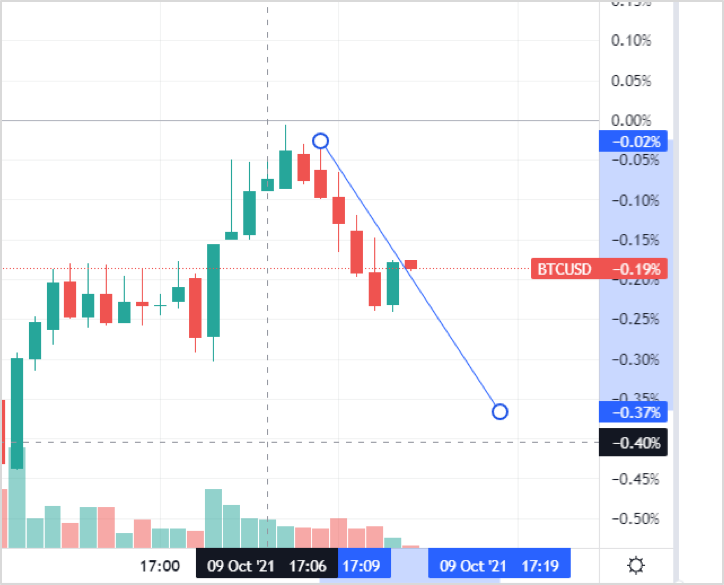
Our price just started to leave the trend upward.
Support and Resistance Levels
Just like there are trend lines showing up and down movement, there are also horizontal lines indicating support (upward pressure) and resistance (downward pressure.) We can draw conclusions about the supply and demand of a coin with these levels.
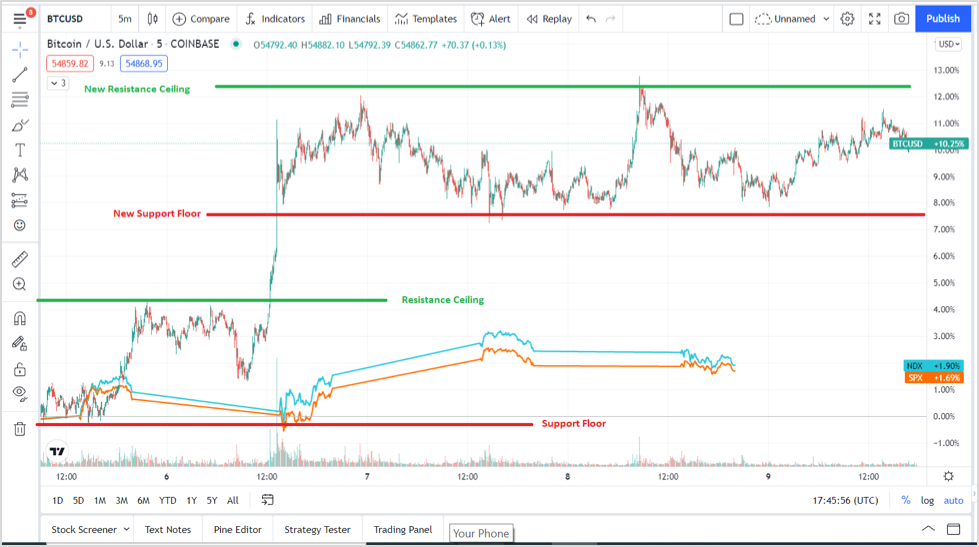
A support level indicates that there are traders who are willing to buy a coin when it drops to a certain point (they believe it is undervalued). When the price reaches this level, a “floor” is created. This demand will prevent the coin’s price from going down further, and with enough demand, the momentum of the price may create an upward trend.
A resistance band is an exact opposite pressure, when a price is reached, holders of a coin will be happy to sell, and a “ceiling” is formed with a supply of sellers available and possibly a downward trend will follow.
A trader that identifies the support and resistance bands can take advantage of the lateral movement—Buying at the support level and selling at the resistance level over and over.
Eventually, there will be a breakout either above the ceiling or below the floor, and this is an indicator that there is a strengthening trend. Further reinforcement of the movement is indicated when the resistance level becomes the new support level with an upward trend (or vice versa in the downward direction), which will usually be tested from above soon after the breakout forms.
PRO TIP– Not all breakouts will succeed, false breakouts happen, but the trend line does not change. Therefore we must use some other indicators to verify the new trend, such as looking at trading volume (if volume is increasing or stays high, then the breakout has strength, if decreasing, then it may fail).
Moving Averages
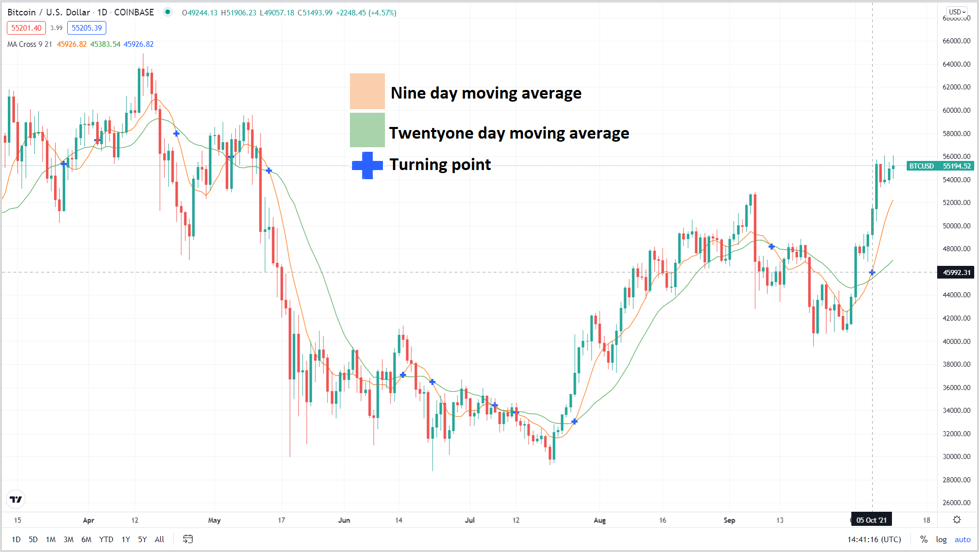
Another tool used for cryptocurrency technical analysis (and all other financial, technical analysis for that matter) is called moving averages (MA), which are used to simplify trend identification. The moving average is the coin’s average price over a chosen time period. You can, for example, have a 21-day moving average which shows the price of a coin’s average over the last three weeks. We connect the dots to form a line.
You can have a MA for any time period; 50, 100 days, and also an exponential moving average (EMA). An EMA gives more weight to the days closer to now than the days farther in the past. An EMA 15 will weigh the past five days of weight with twice the value of the prior ten days (a regular MA gives equal weight to each day).
The following graph shows an example of the 9-day (orange line) and 21-day (green line) moving averages. The blue crosses indicate when the average cross, a cross tells us when a positive or negative trend may be coming. You can see many of the crosses indicate points just after a trend turns.
Trade Volume
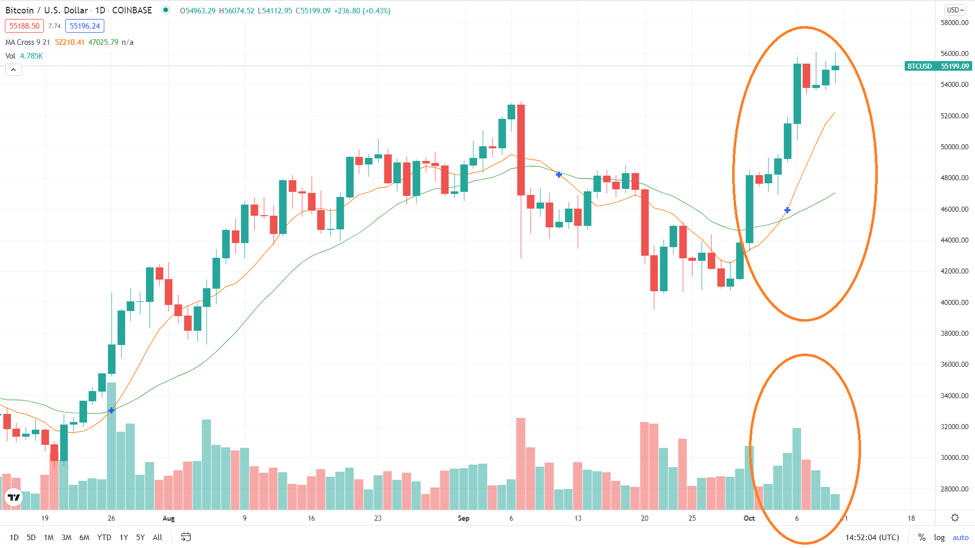
Trade volume will also play an important role in trend identification. Significant trends will be accompanied by high trade volume, while weak trends will lack any volume.
When you see a coin go down, also check its accompanying volume. A longer trend of strong growth will be accompanied by high volume increases and lower volume declines.
Also, look for volume that is rising over time; if the volume is decreasing as the coin’s price increases or decreases, this trend is probably coming to an end, and the trend will go horizontal or turn in the opposite direction.
In the figure below, we see the volume increase (smaller ovel) with the rise in the coin’s price (larger ovel) and it appears to be coming to an end with the decreasing volume.
Use of Crypto Technical Analysis Alone
Traders can use technical analysis to identify trends and the market’s sentiment, allowing them to make wiser investment decisions. However, there are a few central points to remember.
- Technical analysis is a method of weighing past prices of an asset and looking at its trading volume. When you open a trade, you don’t just rely on technical analysis for a decision. Fundamental factors can significantly impact a crypto’s price; big news stories like governmental regulation, mining hash, or even a simple tweet from a billionaire can cause a price to jump or crash. Technical analysis neither takes these into account nor predicts them. So make sure to incorporate fundamental analysis into a trade decision; it is wise to do.
- A technical analyst who buys/sells a coin using fundamental decision-making can improve their return on investment (ROI) if they choose to buy/sell at a sound technical entry point. Though many Fundamental and Technical analysts will ignore each other, the methods can complement each other for better results.
How to get started with crypto technical trading?
Now that we know the basics, we need analytics tools to draw our graphs quickly and easily. Most crypto exchanges will have all of the tools we discussed but not provide trend lines and only give partial indicators. All of the above graphs were done with TradingView, and it provides a variety of other options with its free version. TradingView also has a Premium version for more advanced crypto technical analysis.
Summary and Advice
This guide has provided you with a strong foundation for crypto technical analysis, and though these are just the tip of the technical trading iceberg, they are the main tools and concepts that all technical traders will build from. If you wish to base your trading on technical analysis, you will want to expand your knowledge. The next concepts you can incorporate are Indicators, Fibonacci levels, Patterns such as Triangles, and more.
We also recommend you incorporate fundamental analysis into all of your tradings to make wise decisions. We have a course that also goes through the basics of fundamental crypto trading. You can see that HERE.